3 K’avi Code: Visualizing water quality data with culturally relevant sites
Link to github repo: download files or fork and edit
This activity was recently modified for a day-long data science workshop at the AIHEC/NFEWS meeting in Minneapolis, MN, March 2024.
3.1 Background Info
The EPA is the single biggest funder of tribal water quality programs and that tribes often hire consultants because they do not have staff trained in data analysis. As a result, funds that should stay on the Reservation often flow outward and at greatly inflated costs. This workshop us based on a course at Salish-Kootenai College (SKC), developed by Georgia Smies, and aims to bridge the gap to train students in data analysis. Georgia wrote the background included here.
EPA Reporting Requirements
The EPA has been coordinating with tribal programs since 1973 to strengthen environmental protection of tribal water, air, and land. Most tribes developed their natural resource programs by focusing upon water quality programs first. As a result, many tribes that I[Georgia] work with have at least 30 years of long-term monitoring data of tribal surface waters. Datasets include chemical, physical, and biological parameters of water quality.
The EPA has strict protocols that dictate how samples are collected, analyzed, and assessed. These protocols are summarized in a Quality Assurance Action Plan or QAPP that must be approved before funding is provided for annual monitoring efforts. The QAPP also specifies how data is to be stored, validated, and provides a reporting schedule that Tribes must follow. At a minimum, Tribes must submit annual assessment reports that describe the statistical trends of all monitored parameters. For instance, for each long-term monitoring location, the discharge, water temperature, dissolved oxygen, pH, specific conductance, turbidity, total suspended solids etc. must be analyzed to determine the minimum, mean (or median), and maximum values throughout the annual monitoring period. Chemical and biological data are similarly described. Typically, programs have small annual sample sizes (n<9) so more complex analysis is not possible. The EPA reviews the annual report as part of the funding criteria and makes suggestions to the Tribe as needed.
Current problems with data analysis and reporting
Today, most of the Tribes I work with have not analyzed their long-term datasets for trends because they lack the analysis capacity. This is a serious limitation. The Tribes that have hired me to look at their data as a consultant are often not aware of the environmental changes occurring within their streams. Often, water quality program employees have frequent staff turnovers and long-term familiarity with streams and rivers is not “baked” into the program. Additionally, even the programs like the Northern Cheyenne, who do have staff who have been in the same position for greater 20 years lack the ability to communicate what they intrinsically understand because they lack the data analysis training. For instance, I did work for the CSKT and evaluated 20 years of water quality data on valley bottom streams. I found that water temperature had increased by an average 6 degrees Fahrenheit since 2000. I then coupled my finding with tribal fisheries data that indicated changes in the local fishery. This provided powerful information for the tribes to use for management decisions.
Further, tribes do not have a tool(s) that allows them to evaluate their surface waters based upon what is important to them culturally and spiritually. The EPA asks only for quantitative analysis of measured parameters. Sites that have “good” water quality based upon these parameters are given priority from a management perspective. This analysis does not address what many consider to be the 5 pillars of TEK (native language preservation, traditional food gathering, traditional medicine, cultural practices, spiritual practices, and some would add food sovereignty). As a result, Tribes do not have a means to communicate to the EPA what is important to them and sites that are important culturally may not be given the same protection as those that are assessed using only quantitative assessment of physical variables. In short, western scientific approaches fail to embrace the native world view.
3.2 About the data
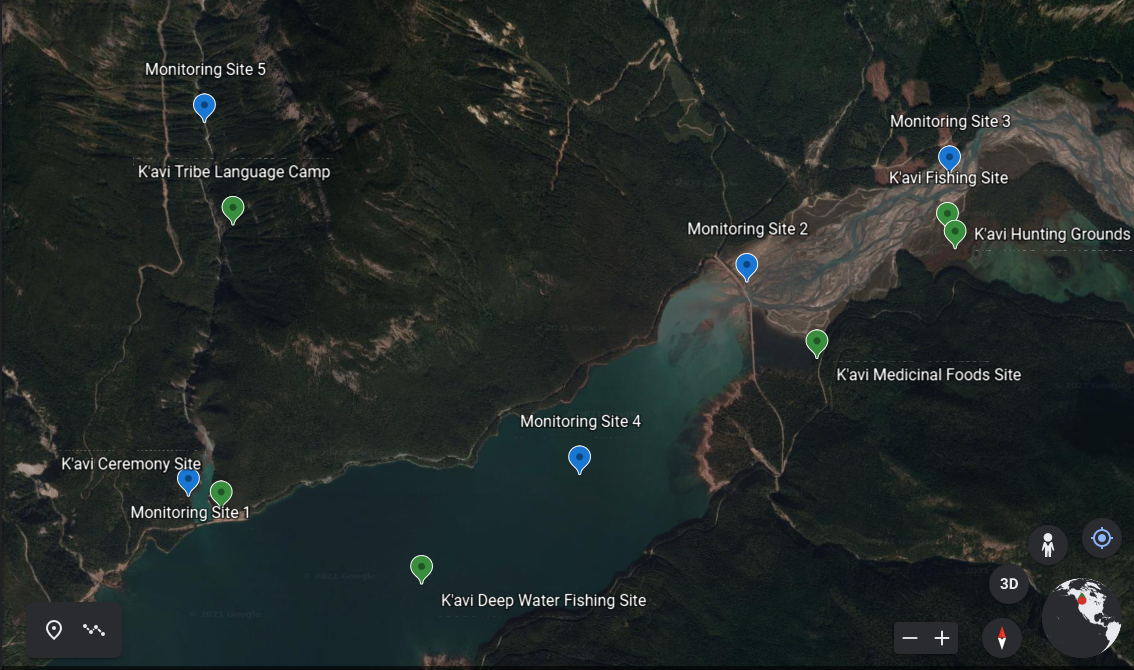
This activity is based on a fictional tribe called the K’avi (my daughter thought this tribe should have a powerful medicinal source that gave them energy and cleared their thinking….what you and I call coffee and thus the name was born). I needed the tribe to be fictional because I did not want to focus on any indigenous groups that I teach. The location is also fictional, but representative of a place with ample surface water, a high elevation stream network fed by glaciers with wetlands and a lake. The photo of the ‘reservation’ is included below, from a remote portion of Banff National Park. The 10 year database is similar to data collected from tribes in Western Montana. To incorporate the TEK element, a layer of sites adjacent to or near the long-term water quality monitoring sites that were important to the K’avi were added. Specifically, there is a language camp, lake and river fishing sites, spiritual ceremony site, hunting area, and a site for gathering medicinal foods.
The water quality variables include: water temperature, dissolved oxygen, specific conductance, and discharge, at a monthly timestep. Water temperature can be meaningful for protecting aquatic communities while maintaining socio-economic benefits (Ouellet-Proulx et al. 2017). Common water temperatures in lakes and streams range between 4 and 35 °C. Dissolved oxygen (DO) is the concentration of oxygen dissolved in water. Common DO concentrations range between 0 and 12 mg L-1 and DO concentrations less than 2 mg L-1 are considered hypoxic, although levels below 5mg/L are low enough to stress out fish (EPA).
3.3 About the code
The goal for this workshop is to get hands-on experience with data management and visualization in R, and to explore the relationship between Western scientific priorities and Indigenous community values.
The main focus is on learning tidyverse and ggplot. It is organized into 5 parts, with each R file numbered in order.
In the first file, we cover R basics, data types and type conversion, data cleaning with dplyr functions, and plotting with ggplot.
In the second file, “2-Visualizing_TEK.R”, we combine our water quality dataset with a ranking of cultural sites based on proximity to monitoring sites (Figure 1). This requires a discussion and survey beforehand, where participants rank cultural sites based on the importance of the traditional ecological knowledge practiced at each site. This ranking will vary based on student’s experiences and backgrounds, and it may differ from the K’avi’s values. By assigning a value to each site we can then compare with the nearby water quality standards to consider which location should be prioritized for management.
3.4 Acknowledgements
This activity was first created by Georgia Smies at Salish-Kootenai College, and developed by Helena S. Kleiner at University of Notre Dame. It was later modified by Cazimir Kowalski, also from University of Notre Dame. The text for setting up R studio was adopted from the MacrosystemsEDDIE Teaching Materials in ‘R You Ready for EDDIE? Module 1’. This work is part of an ongoing project to develop Indigenous data science educational tools with the Ecological Forecasting Initiative.
For presentation at the AIHEC/NFEWS 2024 meeting, this work is supported by funding from the following: the Computer Science Department, University of Minnesota (with support from NSF award 1901099), the Native Food, Energy, and Water Security INCLUDES Alliance (NSF award 2120035); the Environmental Change Initiative, University of Notre Dame; the Alfred P. Sloan Foundation and the Geoscience Alliance (NSF award 2039341).